15 Jul 2026
Visual Analytics Reveal Expenditure Trends in Online Gaming Sectors
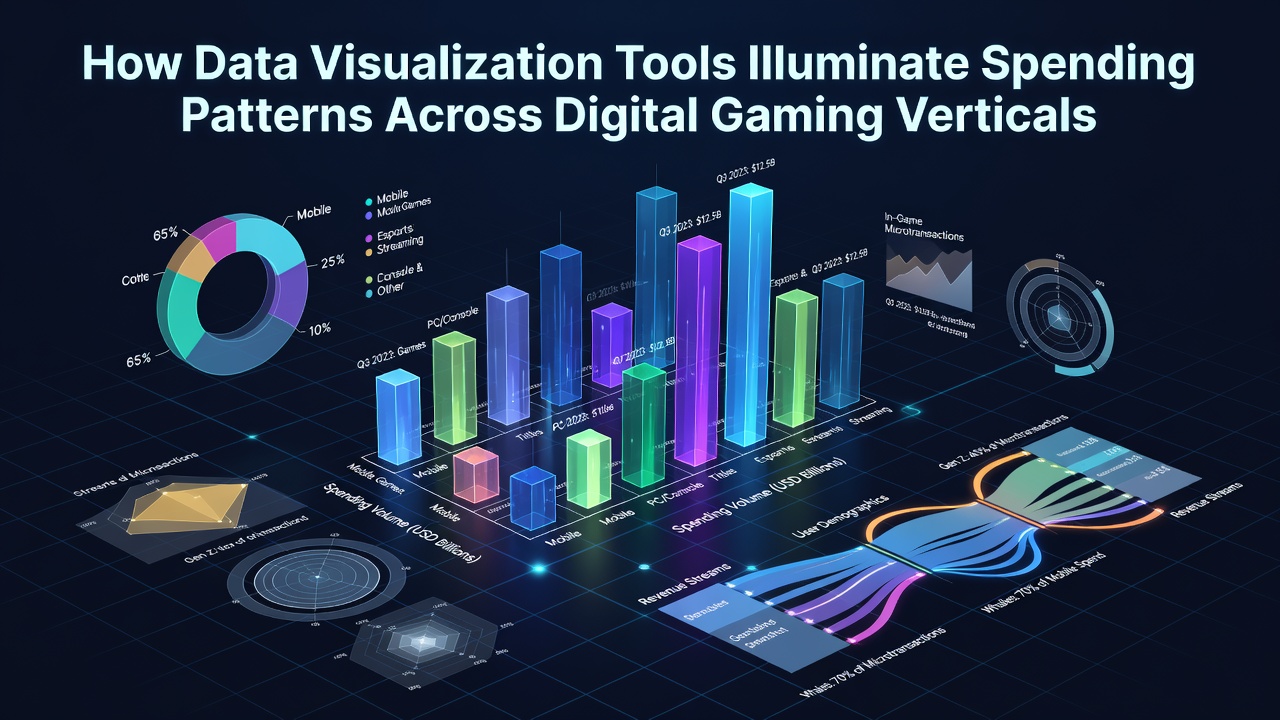
Data visualization tools transform raw transaction records into interactive charts, heatmaps, and dashboards that highlight how players allocate funds across digital gaming verticals such as online slots, sportsbooks, poker rooms, and bingo platforms, and these systems process millions of data points daily to expose seasonal fluctuations, game-specific preferences, and cross-category shifts. Operators deploy platforms like Tableau and Power BI to map deposit volumes against withdrawal patterns while researchers at institutions including the University of Nevada Reno Gaming Research Center track regional variances through layered geographic overlays.
Core Mechanisms Behind Visualization Platforms
Modern tools ingest API feeds from payment processors and game servers then render spending data through color-coded clusters where darker shades represent higher per-session outlays and lighter tones indicate casual engagement levels, and this approach allows analysts to identify peak expenditure windows during evening hours or major sporting events without sifting through spreadsheets. Interactive filters enable segmentation by payment method, player tenure, and device type so patterns emerge such as e-wallet users favoring rapid slot sessions versus credit card players spreading bets across poker tournaments.
Patterns Across Major Gaming Verticals
Slots verticals often display concentrated spending bursts in short timeframes with visualization revealing clusters around progressive jackpot triggers while sportsbooks exhibit steadier flows tied to event calendars and data from Australian Gambling Research Centre reports shows how live betting interfaces drive incremental spend increases during high-profile matches. Poker rooms present distinct rake and tournament buy-in distributions that visualization layers expose through network graphs connecting stake levels to player migration between cash games and multi-table events, and bingo platforms generate steady smaller-ticket patterns that heatmaps differentiate from the high-variance arcs seen in casino table games.
Cross-Vertical Comparisons and Seasonal Shifts
Side-by-side dashboard views compare average spend per active user across categories and one analysis released in July 2026 illustrated how mobile bingo traffic surged during summer months while desktop sports betting volumes dipped amid competing outdoor activities. Such comparisons rely on stacked bar charts and Sankey diagrams that trace fund movement from one vertical to another as players chase bonuses or chase losses and these flows become visible only when tools aggregate anonymized datasets from multiple operators.
Industry Applications and Regulatory Insights
Operators integrate these visualizations into compliance dashboards that flag unusual spend velocity which may signal problem gambling indicators and regulatory bodies in Canada and parts of Europe now require periodic submissions of visualized expenditure reports to monitor market health. American Gaming Association research demonstrates how such tools helped identify a 12 percent rise in cross-device spending during promotional periods without increasing overall participation rates. Teams combine these outputs with machine learning overlays to predict future allocation trends and adjust marketing spend accordingly.
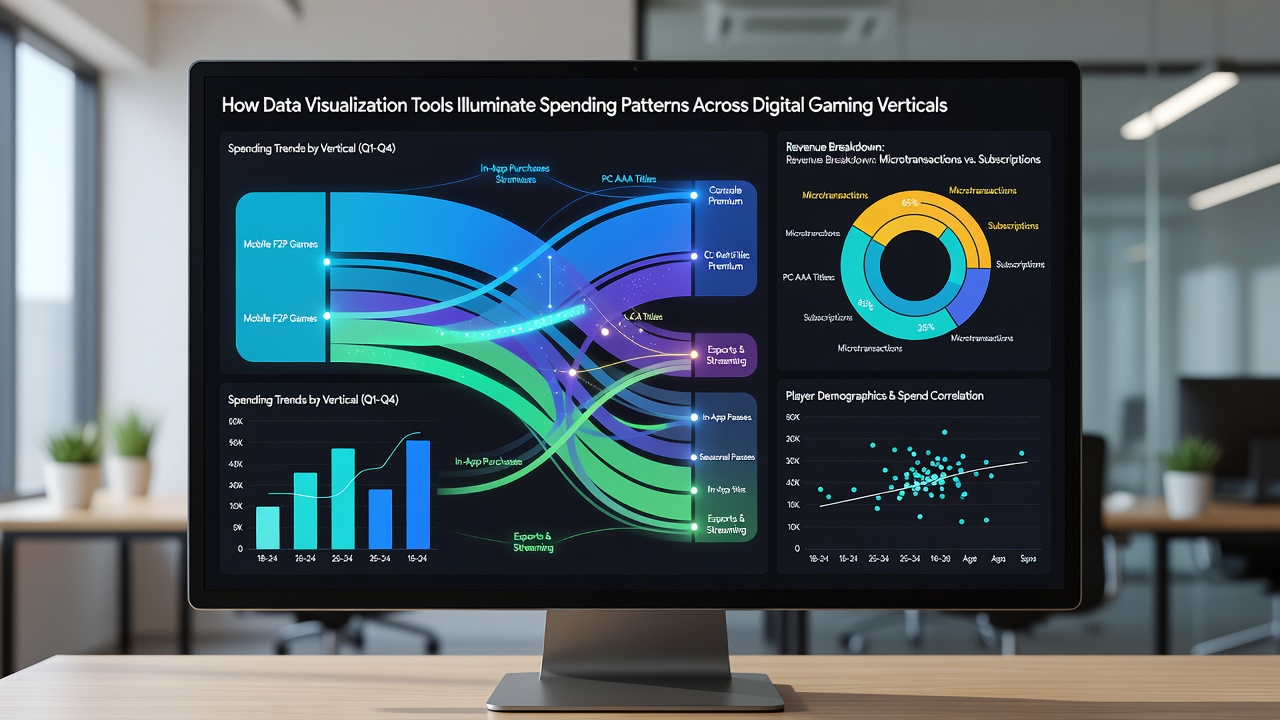
What's interesting is how visualization bridges operational teams with finance departments by presenting unified views that replace fragmented reports and this integration speeds decision cycles when new game launches require rapid spend assessment. Observers note that smaller studios without in-house analysts increasingly adopt cloud-based visualization suites to compete with larger platforms that maintain dedicated data teams.
Future Developments in Gaming Data Presentation
Emerging augmented reality overlays and real-time collaborative dashboards promise to extend these capabilities further by allowing remote stakeholders to explore spend anomalies together during live operations reviews and early tests in European markets show faster identification of underperforming verticals. Academic studies continue to refine color theory applications and interaction design to reduce cognitive load when users navigate multi-dimensional datasets spanning years of transaction history.
Conclusion
Data visualization has become integral to understanding expenditure dynamics across digital gaming verticals by converting complex transaction streams into accessible visual narratives that support operational, regulatory, and strategic decisions. Continued refinement of these tools alongside expanding data sources positions the sector to maintain clearer visibility into spending behaviors as markets evolve through 2026 and beyond.